Economic health has been considered one of the greatest drivers in the SNAP increase in recipients. SNAP increase in recipients has also been linked to economic status, as when the economy cripples, SNAP participation increases, and when the economy is secure, the SNAP enrollees decrease, the Go Banking Rates report says.

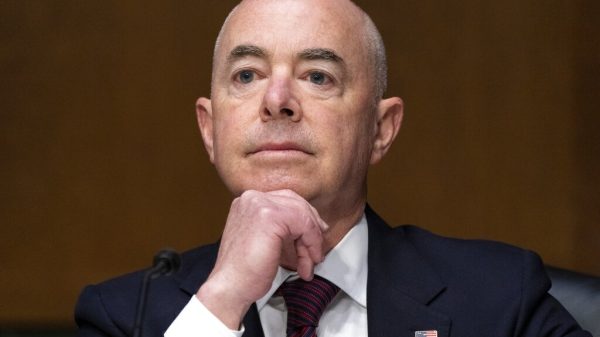
SNAP increase in recipients surged from March 2022 to March of the current year. (Photo: WTXLTallahassee)
SNAP Increase in Recipients: Factors and Drivers
The rise and fall of recipients of SNAP are dependent on several factors and drivers. There are many factors as to why the drastic SNAP increase in recipients in these states (territory) has been evident in the data. A record hauled from Go Banking Rates says that these factors include the state’s provision of good services and the availability and sufficiency of the application and enrollment processes. Below, you may notice how the SNAP increase in recipients’ surged from March 2022 to March of the current year.
While these factors contribute to the SNAP increase in recipients, poverty and hunger remained the key drivers of the SNAP increase in recipients. Some states that experience a rise in the cost of living including rent, gas prices, and high prices at supermarkets have also been depicted in the SNAP increase in recipients. Families who can’t afford diapers are associated with hunger, as when they can’t buy diapers, it only means that they cannot put food on the table.
READ ALSO: Up To $1,691 in SNAP Benefits 2023 To Arrive in Colorado in 3 Days— See Who Qualifies!
SNAP Increase in Recipients: 10 States That Undergo the Most Surge
Data hauled and compiled from Go Banking Rates.
| State/Territory | SNAP Recipients (March 2022) | SNAP Recipients (March 2023) | SNAP Increase in Recipients |
| Louisiana | 774,444 | 907,254 | 17.1% |
| California | 4,612,800 | 5,172,539 | 12.1% |
| Florida | 2,786,261 | 3,058,635 | 9.8% |
| New Hampshire | 69,214 | 75,675 | 9.3% |
| Guam | 34,939 | 37,690 | 7.9% |
| Arizona | 831,414 | 887,565 | 6.8% |
| Nevada | 457,087 | 486,602 | 6.5% |
| Michigan | 1,348,861 | 1,425,331 | 5.7% |
| Virginia | 807,333 | 852,877 | 5.6% |
| Massachusetts | 1,032,580 | 1,087,259 | 5.3% |
READ ALSO: Kansas SNAP Payments Increase by 10%: See Who Qualifies and When to Get Payment!


![Tyson Foods Plant [Photo: Food Manufacturing]](https://southarkansassun.com/wp-content/uploads/2023/08/iStock_1185520857__1_.5e441daa51cca-600x337.jpg)




![Silverado Senior Living Management Inc. [Photo: Los Angeles Times]](https://southarkansassun.com/wp-content/uploads/2023/10/download-6-4-600x337.jpg)

![China's Wuhan Institute of Virology [Photo: Nature]](https://southarkansassun.com/wp-content/uploads/2023/09/d41586-021-01529-3_19239608-600x337.jpg)


